ICR develops avatars to display important cancer cell features to aid diagnosis
12 January 2015
The Institute of Cancer Research, London has developed new software to visualise data generated by imaging of cancer cells in a more intuitive way than graphs or charts.
The program called PhenoPlot generates ‘avatars’ of cancer cells based on imaging data collected by robotic microscopes. These avatars simultaneously display nine important cellular features, such as texture and ‘ruffliness’, which represents inconsistencies in cell shape.
The aim is to help clinicians make faster and more accurate diagnoses based on imaging of patients’ cancer cells.
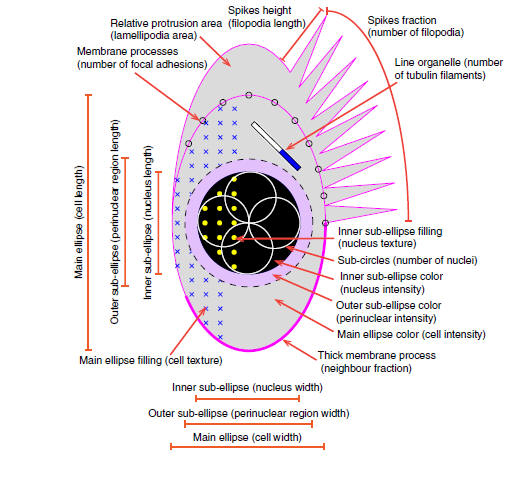
The main visualisation elements in Phenoplot
Automated microscopy can image millions of cells very quickly and is used in genetic or chemical screenings. Robotic microscopes are also being implemented in clinical settings to identify cancer cells in tissues, but because the datasets generated by automated microscopy often contain images of millions of different cells, it is difficult for humans to spot the differences between cells.
While computers can quickly analyse these images, the large and complex datasets they generate are difficult for scientists to interpret using conventional means such as spreadsheets, bar charts, or heat maps. PhenoPlot now allows researchers to analyse these big datasets very quickly.
Preliminary tests by lead author Dr Heba Sailem, who designed PhenoPlot, show how the software can be used to display differences in cell shape between 18 different breast cancer types.
Dr Sailem and her colleagues in the Dynamical Cell Systems laboratory at the ICR used PhenoPlot to portray the phenotypic, or observable, differences in cell shape between aggressive and non-aggressive cancers. Using PhenoPlot allowed the researchers to more easily spot which of the cancer types was the most aggressive and metastatic.
The work has been published in Nature Communications and funded by the BBSRC and Cancer Research UK.
Study leader Dr Chris Bakal, Leader of the Dynamical Cell Systems Team at The Institute of Cancer Research, London, said, “Visual aids can have real power. Florence Nightingale used graphs of time and cause of death in the Crimean War to persuade Queen Victoria of the need for hospital reform. But we have lacked a robust way to visualise and quantify the unique traits of cancer cells.
“Here we have developed software that uses avatars to visually display multiple important features of cancer cells, extracted from huge amounts of data, in a compact and intuitive fashion.
“Tumour biology varies from patient to patient, so having the correct tools to interpret these key differences will be crucial in allowing doctors to tailor treatment for the individual. PhenoPlot can help in the interpretation of cellular imaging data and removes human bias.
“Another attractive aspect of PhenoPlot is that it doesn’t require extensive biological expertise to interpret the images – anyone can use PhenoPlot. Finally, I believe that PhenoPlot avatars are making it very easy to communicate complex datasets about cancer cells to non-scientists.”
Reference
Sailem, H. et al. Visualizing cellular imaging data using
PhenoPlot. Nat. Commun. 6:5825 doi: 10.1038/ncomms6825 (2015).